 JavaScript and Dash AG Grid
The Dash AG Grid component wraps AG Grid and lets you build rich grids with AG Grid using Python. AG Grid itself is
built with JavaScript, but for most AG Grid features, when using Dash AG Grid, you don’t need to know any JavaScript.
Understanding some basics of JavaScript can be helpful, however, if you want to convert examples you find written for AG
Grid in JavaScript to Dash AG Grid or want to write custom functions or components for your grid.
JavaScript AG Grid Examples in Python
Many of the examples in the Dash AG Grid docs are based on examples from
the official AG Grid docs. Some of the key differences in these
examples when written for Python include:
- In JavaScript, boolean values are written in lowercase (
trueorfalse). In Python with Dash AG Grid, the first
letter is capitalized:TrueorFalse nullvalues are written asNonein Python for Dash AG Grid.- Comments in JavaScript are added with //. In Python # at the start of a line is used for comments.
- Variables are declared with const, var, or let in JavaScript. For example,
const gridOptions = <variable>. In
Python, you don’t use a keyword to declare variables. So, the previous example
becomesgridOptions = <variable>. - Object keys in JavaScript do not take quotes. For example, the following column
definition{headerName: "Make", field: "make"}looks like this in Python:{"headerName": "Make", "field": "make"}.
Some great resources on getting started with JavaScript
are MDN JavaScript Basics
and MDN JavaScript Functions
Functions
Some properties in AG Grid take a JavaScript function as inputs. For
example, isRowSelectable allows you to
specify which rows in a grid are selectable. To do this it takes a function that returns false for any rows that
should not be selectable.
In AG Grid that function looks like this:
const isRowSelectable = rowNode => rowNode.data ? rowNode.data.year < 2007 : false;
<AgGridReact><AgGridReact>
To do this in Dash AG Grid, pass a dictionary to isRowSelectable, with the key function, and where the value is the
function to execute.
dag.AgGrid(
    dashGridOptions={'isRowSelectable': {"function": "params.data ? params.data.year < 2007 : false"}},
)
A note on params
In the previous example, params is used in the function. We check if the value in the year column of data for a
record is less than 2007. If it is, we return false.
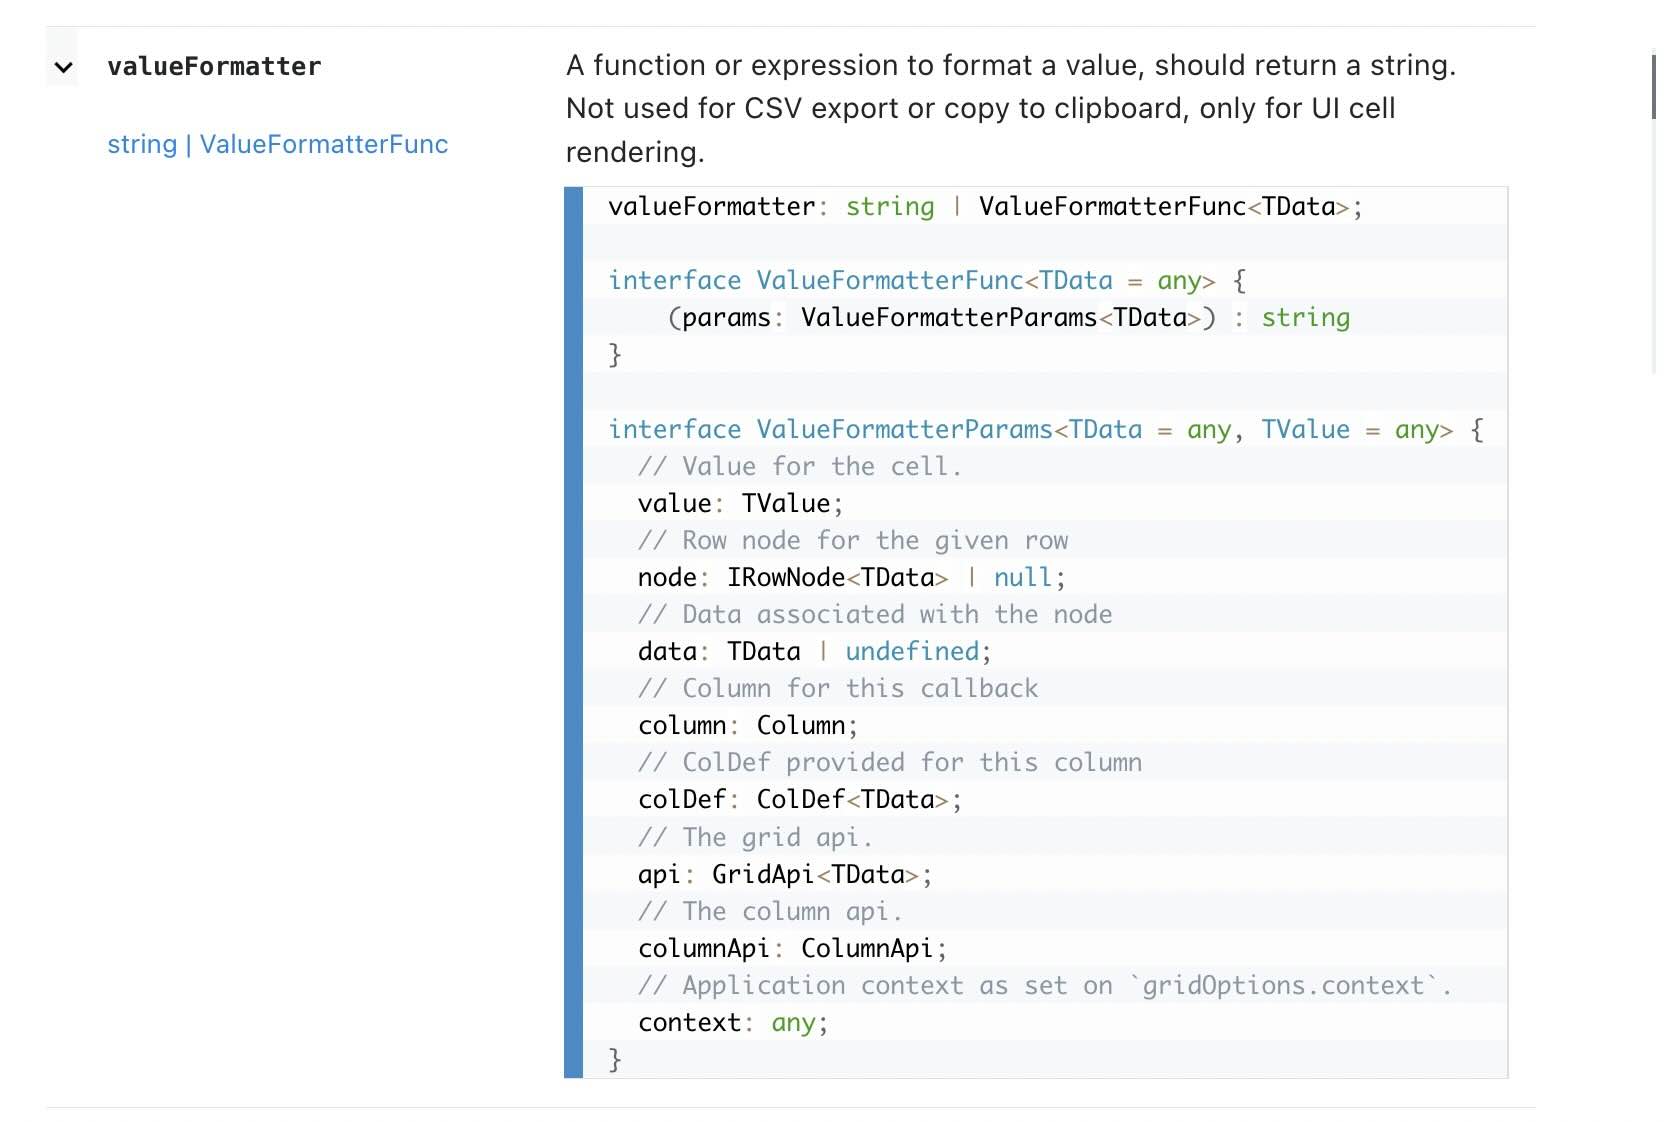
The available params depend on the property you are passing the function to. In the AG Grid docs, you’ll find details
on the parameters available for a property. For example, in
the Value Formatters section of the AG Grid docs,
here are its available params:
Log Function
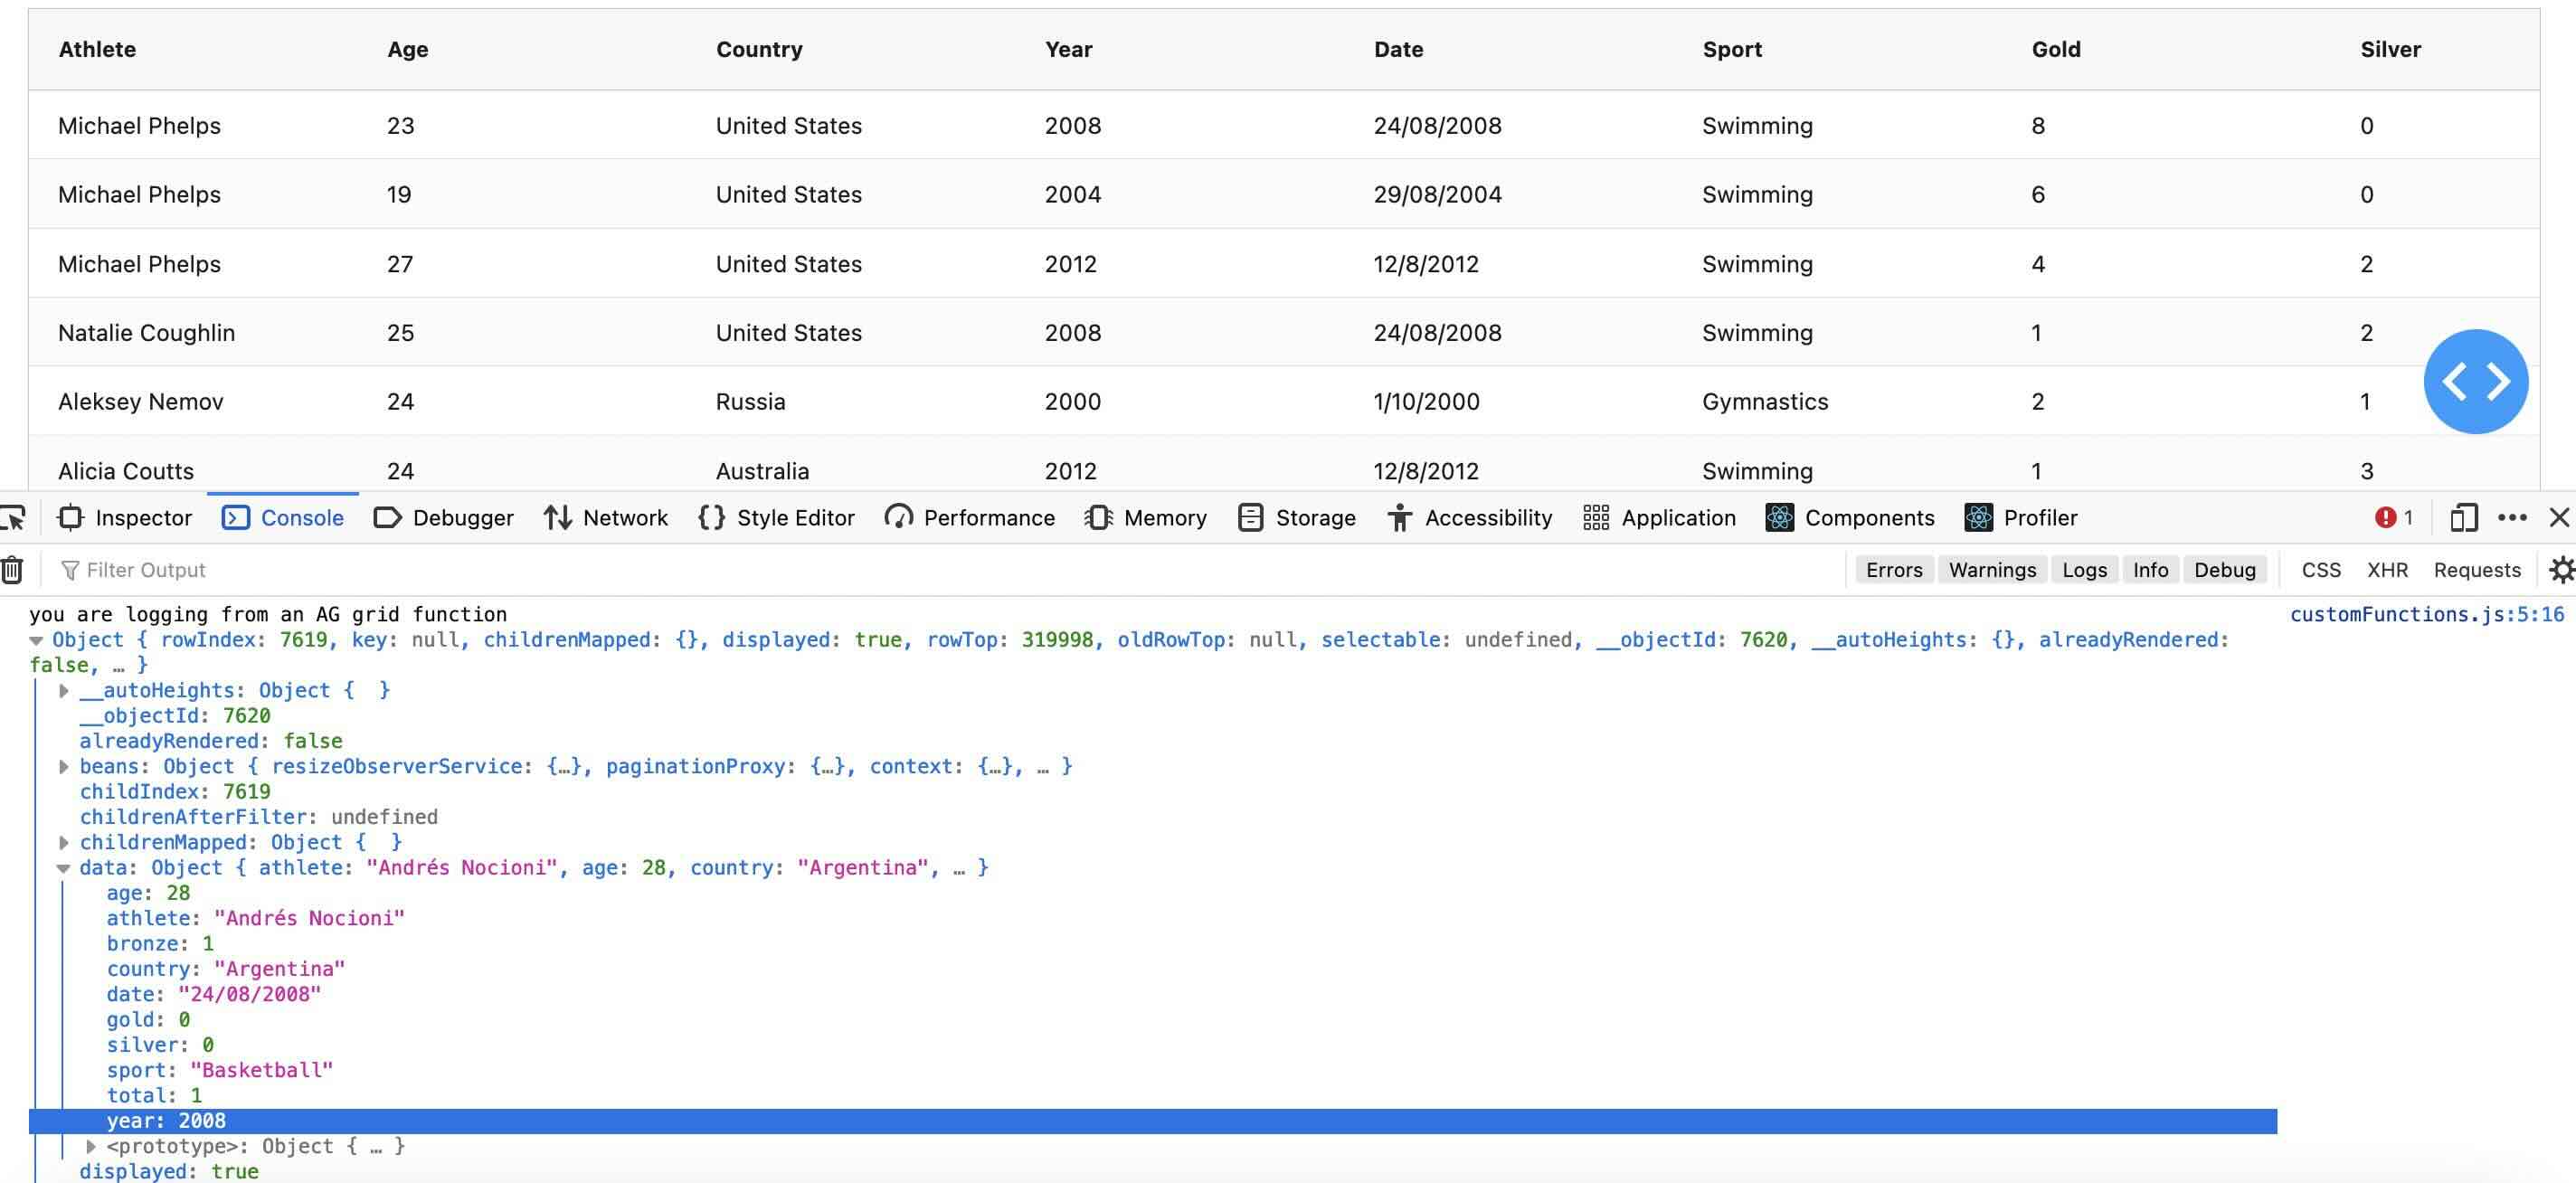
Dash AG Grid also comes with a log function that you can pass to the property to see that property’s available
parameters logged to the console. Here is an example of printing the params available for isRowSelectable.
dag.AgGrid(
    columnDefs=[{"field": i} for i in df.columns],
    rowData=df.to_dict("records"),
    dashGridOptions={
        "rowSelection": {
            'mode': 'singleRow',
            'isRowSelectable': {"function": "log(params)"},
            # 'isRowSelectable': {"function": "params.data.year < 2007"},
        }
    }

)
And here’s the output to the console, where we can see params.data and params.data.year for our rows:
Writing Secure Dash Apps
Executing JavaScript functions passed as a prop can introduce security risks - similar to using
the exec() function in Python. To reduce security risks, only
functions included in the component’s namespace will be executed.
You can include JavaScript functions in the component’s namespace by adding them to dashAgGridFunctions namespace in a
.js file in your app’s assets folder. The functions defined in the window.dashAgGridFunctions object are added to the
grid’s namespace. (The same applies when creating custom components, except you would use
the dashAgGridComponentFunctions namespace. See the components section below for more details.)
Available Functions
For convenience, we include a few JavaScript functions in the dash-ag-grid component’s namespace. The following
functions are available to your app by default and don’t need to be added to its namespace:
Number()andMath()d3-formatandd3-time-formatlibraries. These make it easier to format numbers and dates.
See D3 Value Formatters for more detailslog()- This is a special Dash function for debugging in-line functions - see more information below.
This means you can use Number(), Math(), d3 and log() in-line in your dash app without having to add them to a
.js file in the assets folder.
Inline Functions and dashAgGridFunctions
In addition to the these available functions, you can write your own functions inline, as seen in the example below.
Note that inline functions are evaluated as JavaScript expressions. They must consist of a single expression and cannot
include statements like variable declarations (let, const) or control flow (if/else, for).
dag.AgGrid(
    dashGridOptions={'isRowSelectable': {"function": "params.data ? params.data.year < 2007 : false"}},
)
If your function requires more complex logic, we recommend moving it to a .js file in your app’s assets folder. This allows
you to write standard JavaScript functions that can be referenced by name.
For more on adding custom JS to your Dash App,
see the External Resources page
Here is an example of custom currency formatting function:
dashAgGridFunctions.js
var dagfuncs = window.dashAgGridFunctions = window.dashAgGridFunctions || {};


dagfuncs.EUR = function (number) {
    return Intl.NumberFormat('de-DE', {style: 'currency', currency: 'EUR'}).format(number);
}
And here is the function used in columnDefs:
columnDefs = [
    {"headerName": "Euro", "field": "Euros", "valueFormatter": {"function": "EUR(params.value)"}},
]
Components
In addition to passing functions to properties that accept them, you can write your own components to use with cell
renderers. In this case, you’d add them to the dashAgGridComponentFunctions namespace in
a dashAgGridComponentFunctions.js file in your app’s assets folder.
For example, here is a component that returns links to stock prices.
var dagcomponentfuncs = (window.dashAgGridComponentFunctions = window.dashAgGridComponentFunctions || {});

dagcomponentfuncs.StockLink = function (props) {
    return React.createElement(
        'a',
        {href: 'https://finance.yahoo.com/quote/' + props.value},
        props.value
    );
};
This is then available to use as a cell renderer in the AG Grid component:
import dash_ag_grid as dag
from dash import Dash, html, dcc
import pandas as pd

data = {
    "ticker": ["AAPL", "MSFT", "AMZN", "GOOGL"],
    "company": ["Apple", "Microsoft", "Amazon", "Alphabet"],
    "quantity": [75, 40, 100, 50],
}
df = pd.DataFrame(data)

columnDefs = [
    {
        "headerName": "Stock Ticker",
        "field": "ticker",
        # stockLink function is defined in the dashAgGridComponentFunctions.js in assets folder
        "cellRenderer": "StockLink",
    },
    {
        "headerName": "Company",
        "field": "company",
    },
    {
        "headerName": "Shares",
        "field": "quantity",
        "editable": True,
    },
]

grid = dag.AgGrid(
    columnDefs=columnDefs,
    rowData=df.to_dict("records"),
    columnSize="sizeToFit",
    defaultColDef={"editable": False},
)

app = Dash()

app.layout = html.Div(
    [dcc.Markdown("Adding links with cellRenderer"), grid],
    style={"margin": 20},
)

if __name__ == "__main__":
    app.run(debug=True)
For more detail on the above example and custom components in general, see
the the Custom Cell Renderers section.