 Structure of Datasets
In vtk.js because we mostly focus on Rendering we only have 2 types of data structures. We have a vtkPolyData that can be used for geometry rendering and a vtkImageData that can be used for volume rendering. In proper VTK, we have more types of DataSets and we have several filters that help you convert from one type to another.
Here we explain some of the foundation of those data structures so you could create them by hand if you wanted to.
ImageData
An ImageData is an implicit grid that is axis aligned as shown in the picture below.
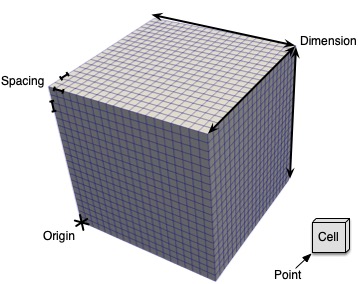
The set of properties that can be given to ImageData are as follow:
- origin: location of the bottom left corner of the grid in the 3D world
- dimensions: how many points we have along each axis
- spacing: what is the uniform spacing along each axis between the points
A concrete example would be a grid of 5 points or 4 cells along each axis which will go from [-2, 2] along each axis.
dash_vtk.ImageData(
  dimension=[5,5,5],
  origin=[-2,-2,-2],
  spacing=[1,1,1],
)
View full code
View full code
from dash import html
import dash_vtk

html.Div([dash_vtk.View([
    dash_vtk.VolumeRepresentation([
        # GUI to control Volume Rendering
        # + Setup good default at startup
        dash_vtk.VolumeController(),
        # Actual Imagedata
        dash_vtk.ImageData(
            dimensions=[5, 5, 5],
            origin=[-2, -2, -2],
            spacing=[1, 1, 1],
            children=[
                dash_vtk.PointData([
                    dash_vtk.DataArray(
                        registration="setScalars",
                        values=list(range(5*5*5)),
                    )
                ])
            ],
        ),
    ]),
])], style={"width": "100%", "height": "400px"})
PolyData
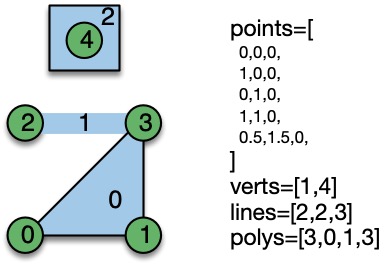
A PolyData is a surface mesh composed of points and cells. The cells can be:
- verts: Vertex or point to show as a tiny square on the screen
- lines: Lines that connect points into a one segment or multi segment line
- polys: Polygons which are convex surfaces such as triangles, rectangles, circles…
- strips: Triangle strips efficiently combine triangles together with no repeated points just for connectivity
The way cells are defined is via an index-based array that maps to a given point index. For example let’s pretend you want to create a line with 2 segments, you will need at least 3 points defined in the points array. If those points are defined first in your points array, then the lines array should be filled as follows:
nb_points = 3
lines = [nb_points, 0, 1, 2]
To create 2 lines independent of each other, you can do it as follows:
lines = [
  3, 0, 1, 2,        # First line of 2 segments / 3 points
  2, 3, 4,           # Second line of 1 segment / 2 points
  4, 10, 11, 12, 14  # Third line of 3 segments / 4 points
]
You can see a concrete example in the image below.
View full code
View full code
from dash import html
import dash_vtk

html.Div([dash_vtk.View([
    dash_vtk.GeometryRepresentation(
        children=[
            dash_vtk.PolyData(
                points=[
                  0,0,0,
                  1,0,0,
                  0,1,0,
                  1,1,0,
                ],
                lines=[3, 1, 3, 2],
                polys=[3, 0, 1, 2],
                children=[
                    dash_vtk.PointData([
                        dash_vtk.DataArray(
                            #registration='setScalars', # To activate field
                            name='onPoints',
                            values=[0, 0.33, 0.66, 1],
                        )
                    ]),
                    dash_vtk.CellData([
                        dash_vtk.DataArray(
                            # registration='setScalars', # To activate field
                            name='onCells',
                            values=[0, 1],
                        )
                    ])
                ],
            ),
        ],
    ),
])], style={"width": "100%", "height": "400px"})
The dash_vtk.PolyData element has an additional property to automatically generate cells based on some assumption of the order of the points defined in the points array. That property is named connectivity and defaults to manual, meaning no automatic action is taken. But that property can be set to points to automatically set the vertex to actually see the points provided or triangles which uses each set of 3 consecutive points to create a triangle and finally strips which consumes all the points in a single strip of triangles.
Fields
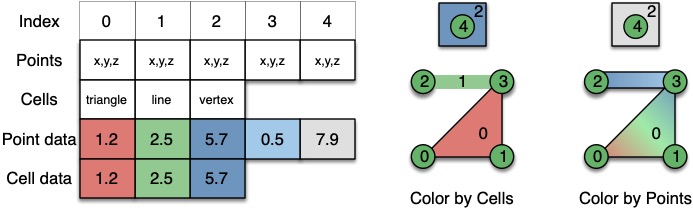
Having a grid is a good start, but most likely you would want to attach a field to a given mesh so you can start looking at it in a 3D context.
Fields are arrays that map to either Points or Cells. They could be scalars or vectors of different size.
The diagram below tries to explain the difference between fields located on points vs cells in term of rendering, but it also truly has a different meaning based on the type of data that you have.
Caution: By convention, we always attach data to points in an ImageData for doing VolumeRendering and the array must be registered as scalars.