Other Dash VTK Components
Mesh
This element is a helper on top of PolyData which has a helper function that goes with it which will help you map a vtkDataSet into a single property of the Mesh element.
def Mesh(**kwargs):
    return dash_vtk.PolyData(
        **kwargs.get('state').get('mesh'),
        children=[
            dash_vtk.[kwargs.get('state').get('field').get('location')]([
                dash_vtk.DataArray(
                  **kwargs.get('state').get('field'),
                )
            ])
        ]
    )
Note that we assume that state.field exists when we use kwargs.get('state').get('field').get('location') in the snippet above. However, state.field is optional, so when it’s not available the children is not created, and kwargs.get('state').get('field').get('location') would not be needed.
The Mesh element expects a single state property that is internally split into 2 elements to represent the geometry and the field that you want to optionally attach to your mesh. The structure could be defined as follows:
- state
- mesh: (Contains the properties of PolyData)
- points = []
- verts = []
- lines = []
- polys = []
- strips = []
- connectivity = ‘manual’ # [manual, points, triangles, strips]
- field: (Contains the properties of DataArray)
- location: “PointData” / “CellData”
- name: Name of the field (optional)
- values: Array of values for the field
- numberOfComponents: Number of components per point/cell
- type: Name of TypedArray to use (Uint8Array, Int8Array, Float32Array, Float64Array…)
Volume
This element is a helper on top of ImageData which has a Python helper function that goes with it which will help you map a vtkImageData into a single property of the Volume element.
def Volume(**kwargs):
    return dash_vtk.ImageData(
        **kwargs.get('state').get('image'),
        children=[
            dash_vtk.PointData([
                dash_vtk.DataArray(
                  **kwargs.get('state').get('field'),
                )
            ])
        ]
    )
The Volume element expects a single state property that is internally split into 2 elements to represent the geometry and the field that you want to optionally attach to your mesh. The structure could be defined as follows:
- state
- image: (Contains the properties of ImageData)
- dimensions
- spacing
- origin
- field: (Contains the properties of DataArray)
- values: Array of values for the field
- numberOfComponents: Number of components per point/cell
- type: Name of TypedArray to use (Uint8Array, Int8Array, Float32Array, Float64Array…)
Algorithm
This element allows you to create and configure a vtk.js class. This element expect only 2 properties:
- vtkClass: The name of the vtkClass to instantiate.
- state: The set of properties to apply on the given vtkClass.
The current list of classes available to instantiate are:
- vtkClass:
- vtkConcentricCylinderSource
- vtkConeSource
- vtkCubeSource
- vtkCylinderSource
- vtkLineSource
- vtkPlaneSource
- vtkPointSource
- vtkSphereSource
- vtkWarpScalar
- state: See the references above for the properties available for each vtkClass.
The following example uses a vtk source in vtk.js to generate a mesh
from dash import Dash, html
import dash_vtk

content = dash_vtk.View([
    dash_vtk.GeometryRepresentation(
        mapper={
            'colorByArrayName': 'layer',
            'scalarMode': 4,
            'interpolateScalarsBeforeMapping': False,
        },
        colorMapPreset="jet",
        colorDataRange=[0.2, 0.9],
        children=[
          dash_vtk.Algorithm(
              vtkClass="vtkConcentricCylinderSource",
              state={
                  'height': 0.25,
                  'radius': [0.2, 0.3, 0.4, 0.6, 0.7, 0.8, 0.9, 1],
                  'cellFields': [0, 0.2, 0.4, 0.6, 0.7, 0.8, 0.9, 1],
                  'mask': [1, 0, 1, 0, 1, 0, 1, 1],
                  'resolution': 60,
                  'skipInnerFaces': True,
                  'startTheta': 45,
                  'endTheta': 315,
                  'center': [0, 0, 0.5],
              },
          ),
        ]
    ),
])

# Dash setup
app = Dash()
server = app.server

app.layout = html.Div(
    style={"width": "100%", "height": "400px"},
    children=[content],
)

if __name__ == "__main__":
    app.run(debug=True)

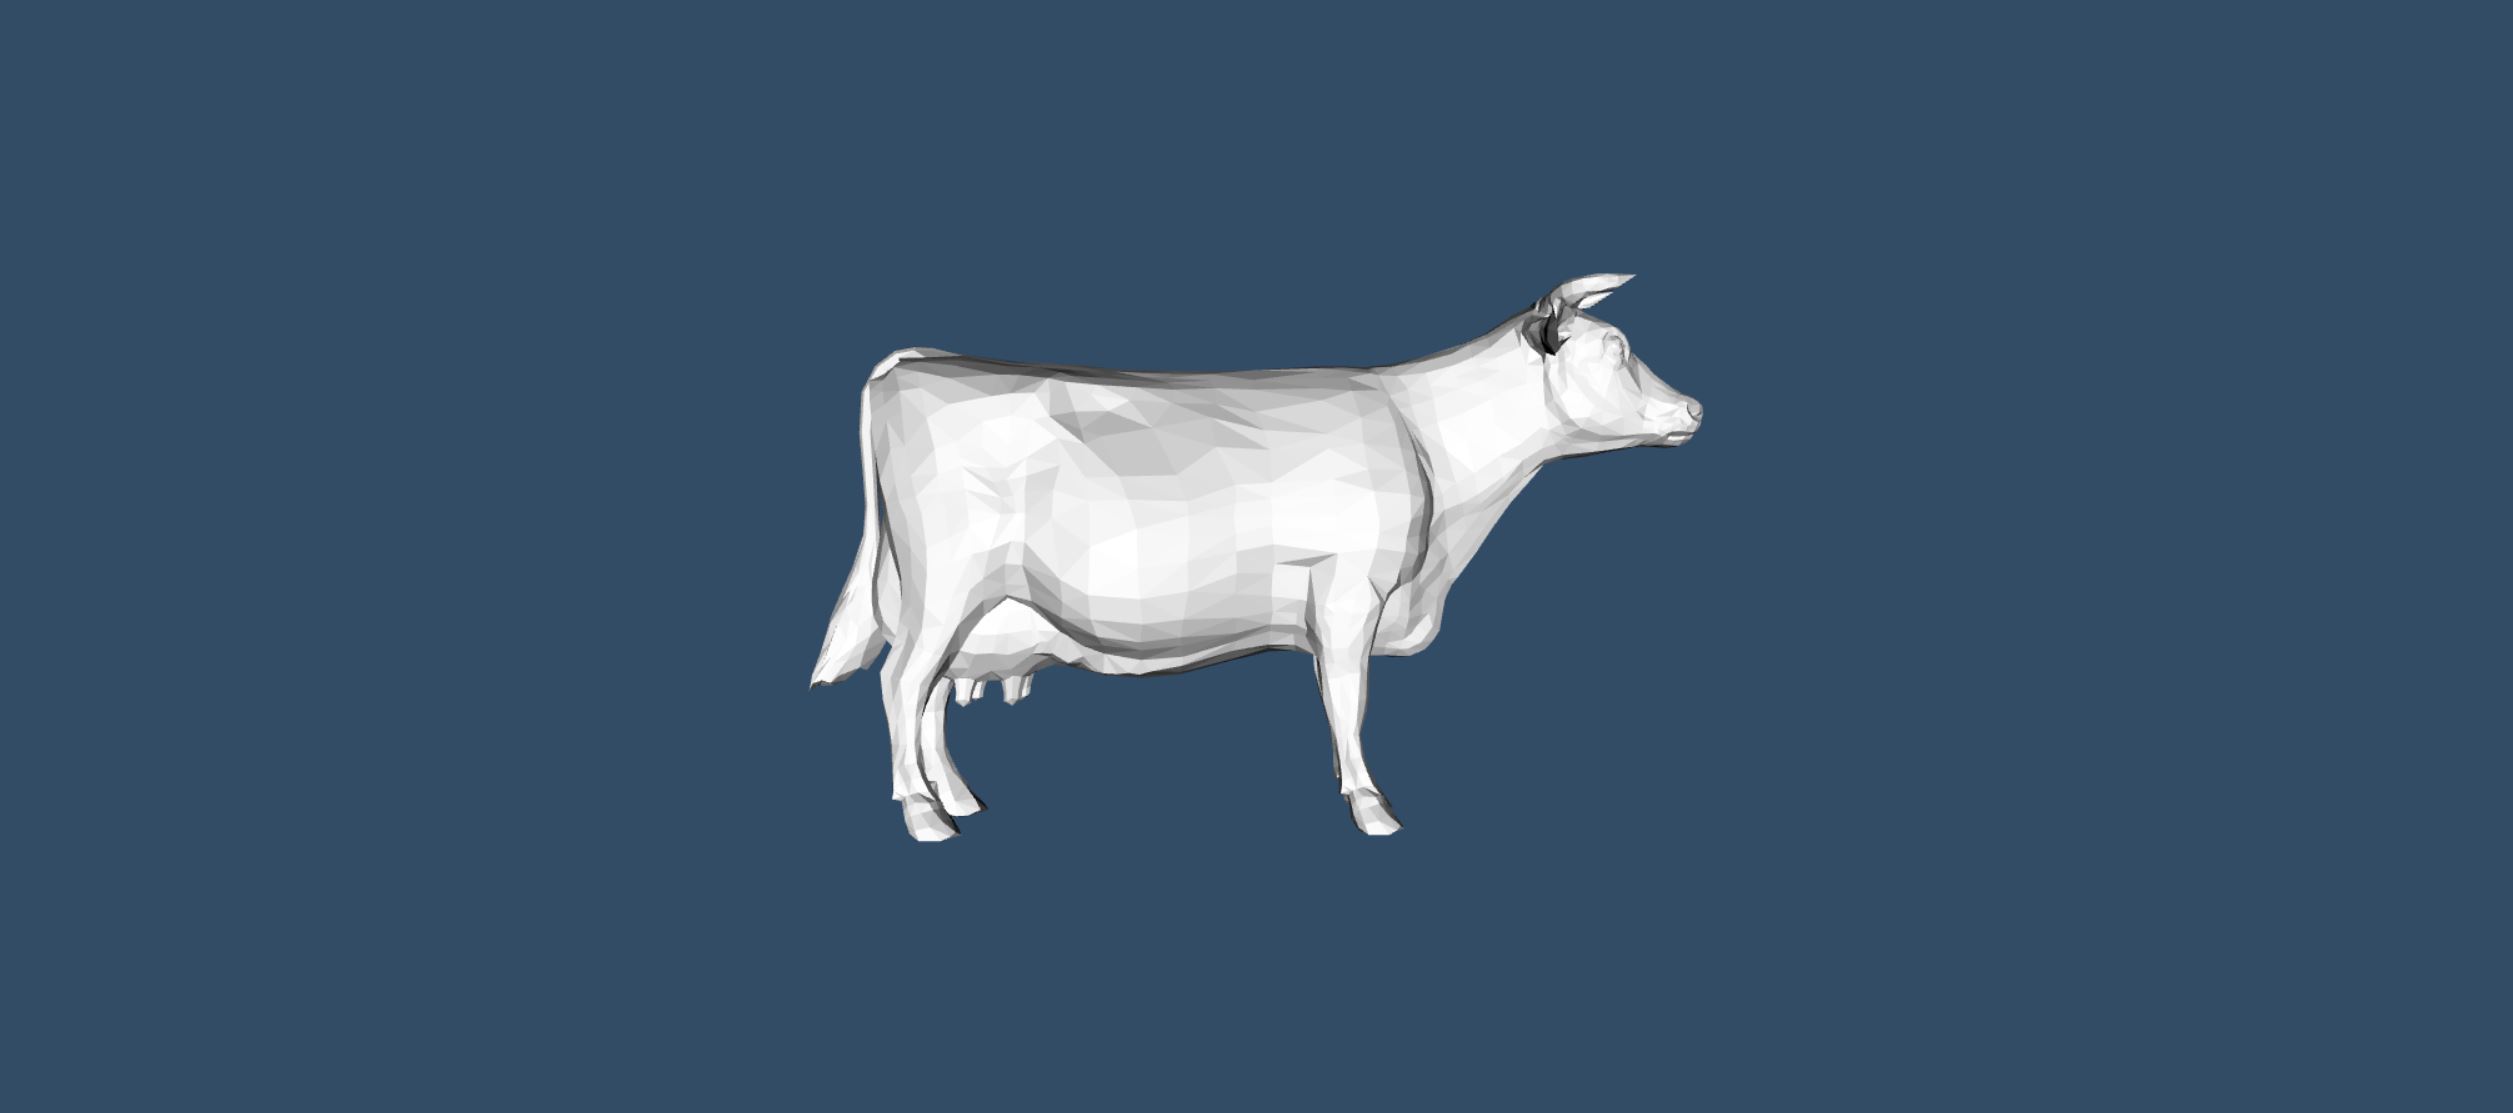
Reader
This element is similar to the Algorithm except that it focuses on vtk.js readers by allowing you to leverage their custom API.
Like Algorithm, a reader expects a vtkClass among those listed below:
- vtkClass
- vtkPLYReader
- vtkSTLReader
- vtkElevationReader
- vtkOBJReader
- vtkPDBReader
- vtkXMLImageDataReader
- vtkXMLPolyDataReader
Then use one of the properties below to feed the reader some data:
- url: set of url to fetch data from (on the JS side)
- parseAsText: set the text content to process
- parseAsArrayBuffer: set binary data to process from base64 string
Since the data loading is going to be asynchronous, we’ve enabled some automatic callbacks to either trigger a render or a resetCamera once the data became available. To enable these callbacks, set the following properties to your liking:
- renderOnUpdate: True (default)
- resetCameraOnUpdate: True (default)
from dash import Dash, html

import dash_vtk

# Get it here: <a href="https://github.com/plotly/dash-vtk/blob/master/demos/data/cow-nonormals.obj">https://github.com/plotly/dash-vtk/blob/master/demos/data/cow-nonormals.obj</a>
obj_file = "datasets/cow-nonormals.obj"


txt_content = None
with open(obj_file, 'r') as file:
  txt_content = file.read()

content = dash_vtk.View([
    dash_vtk.GeometryRepresentation([
        dash_vtk.Reader(
            vtkClass="vtkOBJReader",
            parseAsText=txt_content,
        ),
    ]),
])

# Dash setup
app = Dash()
server = app.server

app.layout = html.Div(
    style={"width": "100%", "height": "400px"},
    children=[content],
)

if __name__ == "__main__":
    app.run(debug=True)
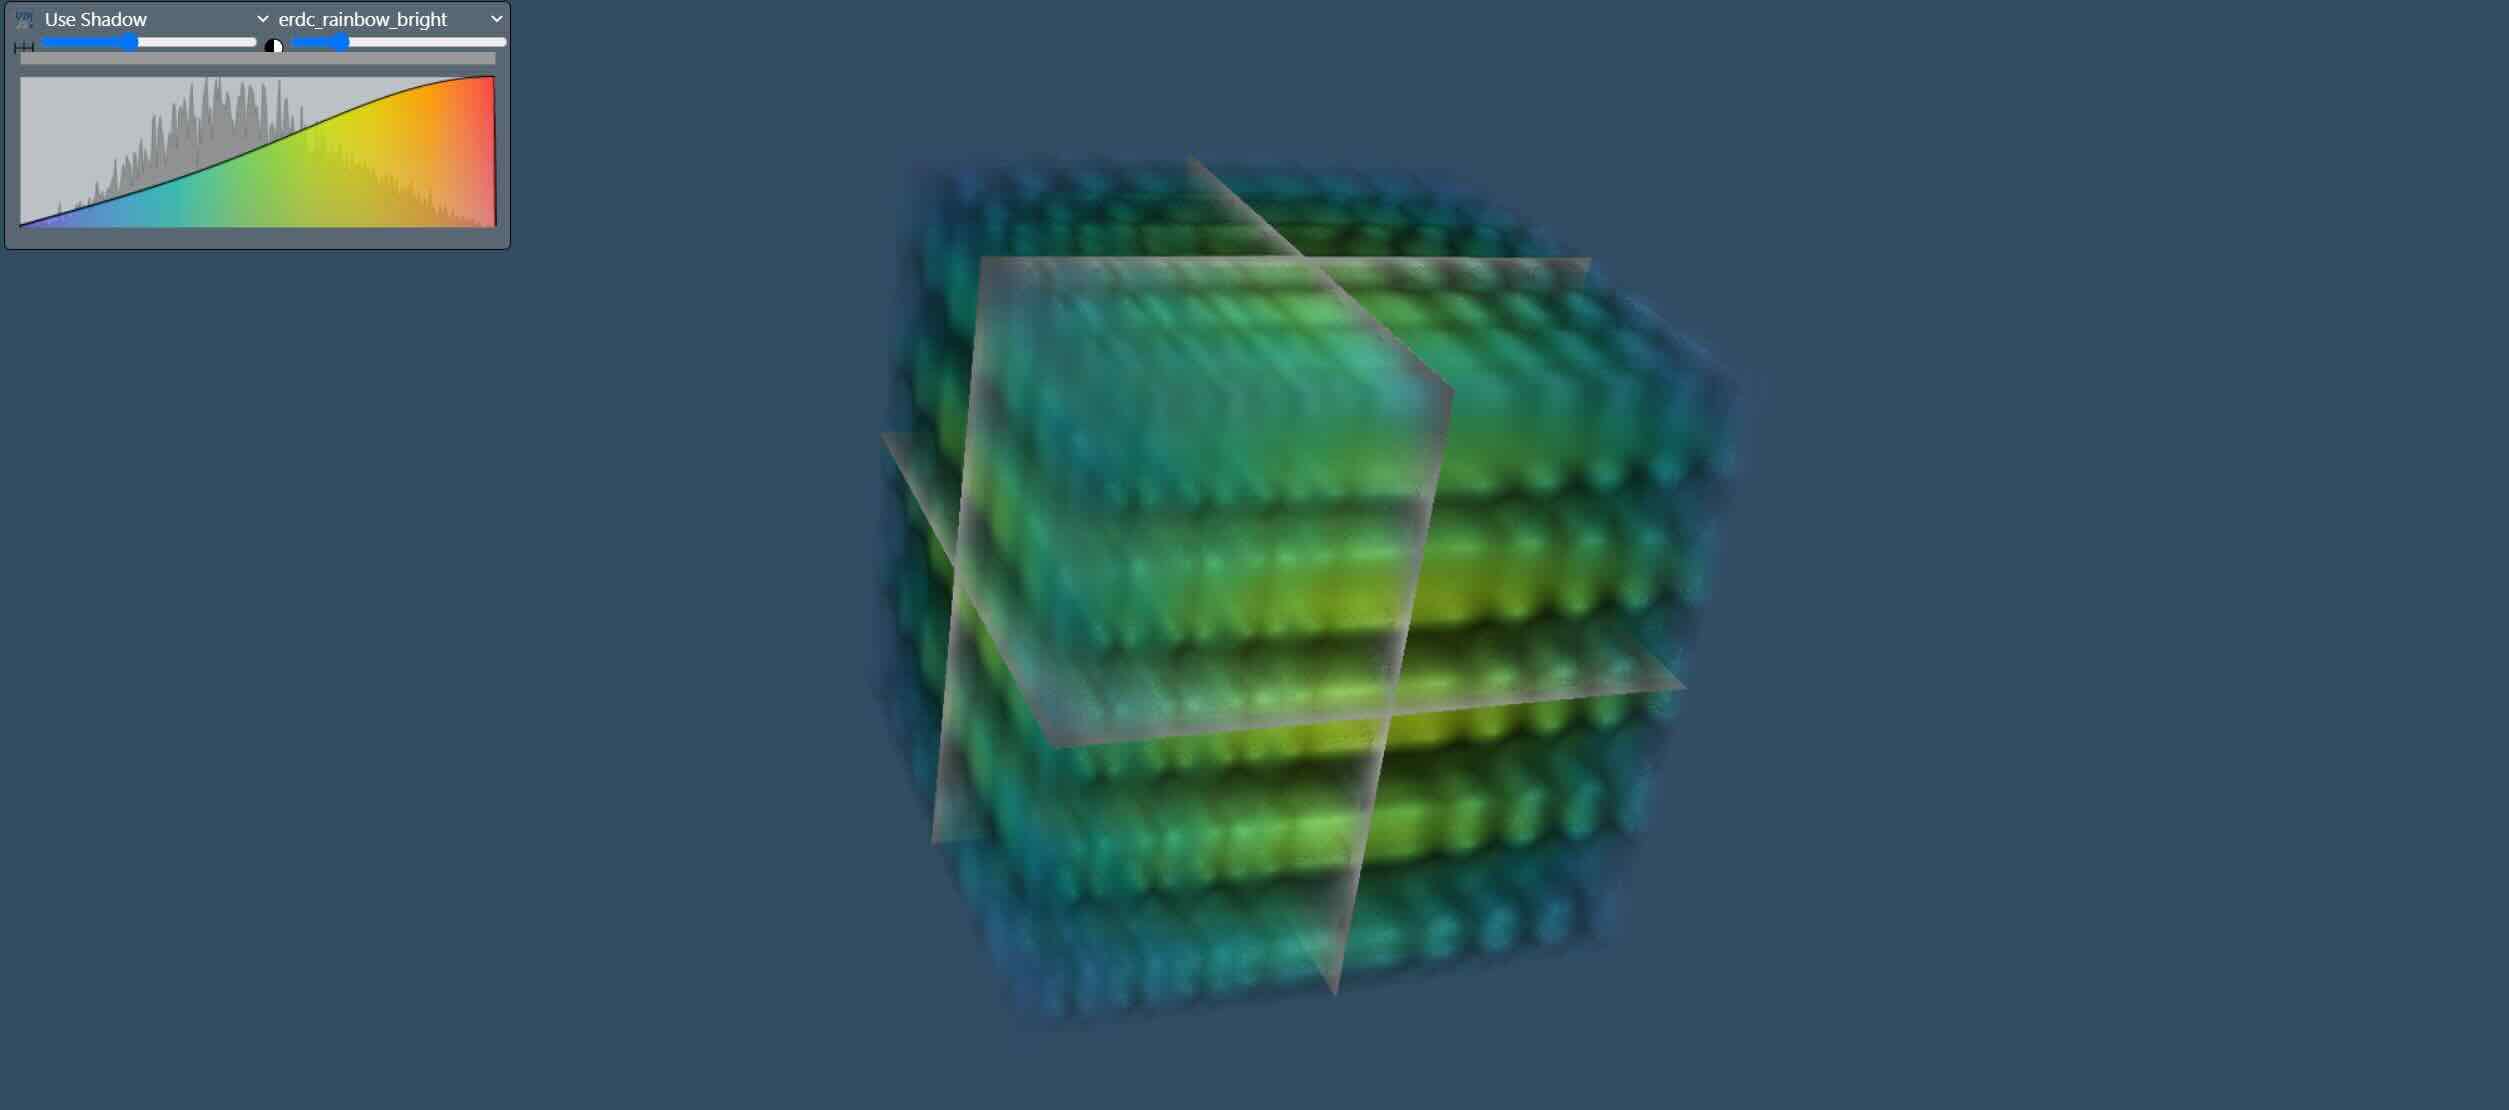
ShareDataSet
This element does not affect the dataset, but it allows the JavaScript side to reuse an existing vtkDataSet for another Representation or filter.
The only property expected in a ShareDataSet is a name to properly reference it elsewhere. A name is provided dy default, so in the case of only one dataset, you would not need to specify this property.
The following example shows how to create a view with one Volume and four representations of it.
View full code
View full code
from dash import Dash, html

import dash_vtk
from dash_vtk.utils import to_volume_state

try:
    # VTK 9+
    from vtkmodules.vtkImagingCore import vtkRTAnalyticSource
except ImportError:
    # Old VTK
    from vtk.vtkImagingCore import vtkRTAnalyticSource

# Use VTK to get some data
data_source = vtkRTAnalyticSource()
data_source.Update()  # <= Execute source to produce an output
dataset = data_source.GetOutput()

# Use helper to get a volume structure that can be passed as-is to a Volume
volume_state = to_volume_state(dataset)  # No need to select field

content = dash_vtk.View([
    dash_vtk.VolumeRepresentation([
        # GUI to control Volume Rendering
        # + Setup good default at startup
        dash_vtk.VolumeController(),
        # Actual volume
        dash_vtk.ShareDataSet([
            dash_vtk.Volume(state=volume_state),
        ]),
    ]),
    dash_vtk.SliceRepresentation(
        iSlice=10,
        children=[
            dash_vtk.ShareDataSet(),
        ]
    ),
    dash_vtk.SliceRepresentation(
        jSlice=10,
        children=[
            dash_vtk.ShareDataSet(),
        ]
    ),
    dash_vtk.SliceRepresentation(
        kSlice=10,
        children=[
            dash_vtk.ShareDataSet(),
        ]
    ),
])

# Dash setup
app = Dash()
server = app.server

app.layout = html.Div(
    style={"width": "100%", "height": "400px"},
    children=[content],
)

if __name__ == "__main__":
    app.run(debug=True)