 Cell Editor Components
Create your own cell editor by providing a cell editor component.
Note that as of Dash AG Grid V31.0.0, there are
7 Provided Cell Editors, including a Date Cell Editor
and a Number Cell editor.
See more information on custom Cell Editor Components in
the AG Grid documentation
Custom Date Picker
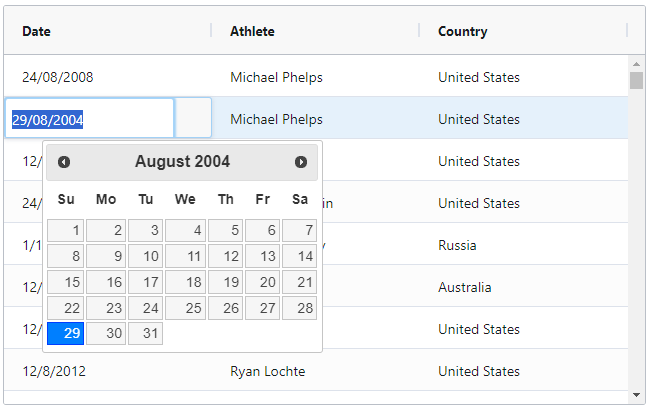
This example demonstrates how to use a custom date picker as a cell editor. The ‘Date’ column uses a Component cell
editor that allows you to pick a date using jQuery UI Datepicker.
Notes about this example
- the jQuery is included as external scripts and stylesheets in the app constructor.
- The Custom
DatePickeris defined in thedashAgGridFunctions.jsfile in theassetsfolder. - The Custom
DatePickeris supplied by name viacellEditor. - You can change the format of the date returned from the
DatePickerin theDatePickerfunction.
This example has not been ported to R yet - showing the Python version instead.
Visit the old docs site for R at: https://community.plotly.com/c/dash/r/21
import dash_ag_grid as dag
from dash import Dash, html, dcc
import pandas as pd

app = Dash(__name__, external_scripts=["https://cdnjs.cloudflare.com/ajax/libs/jquery/1.12.1/jquery.min.js", "https://cdnjs.cloudflare.com/ajax/libs/jqueryui/1.12.1/jquery-ui.min.js",], external_stylesheets=["https://cdnjs.cloudflare.com/ajax/libs/jqueryui/1.12.1/jquery-ui.min.css"],)


df = pd.read_csv(
    "https://raw.githubusercontent.com/plotly/datasets/master/ag-grid/olympic-winners.csv"
)


columnDefs = [
    {"field": "date", "cellEditor": {"function": "DatePicker"}},
    {"field": "athlete"},
    {"field": "country"},
]

defaultColDef = {"flex": 1, "minWidth": 150, "editable": True}

app.layout = html.Div(
    [
        dcc.Markdown("Custom Date Picker Cell Editor Example"),
        dag.AgGrid(
            id="custom-date-picker-cell-editor",
            columnDefs=columnDefs,
            rowData=df.to_dict("records"),
            defaultColDef=defaultColDef,
            dashGridOptions={"animateRows": False}
        ),
    ]
)

if __name__ == "__main__":
    app.run(debug=True)

To run the example above, add this to the dashAgGridFunctions.js file in your app’s assets folder:
var dagfuncs = window.dashAgGridFunctions = window.dashAgGridFunctions || {};

dagfuncs.DatePicker = class {

    // gets called once before the renderer is used
    init(params) {
        // create the cell
        this.eInput = document.createElement('input');
        this.eInput.value = params.value;
        this.eInput.classList.add('ag-input');
        this.eInput.style.height = 'var(--ag-row-height)';
        this.eInput.style.fontSize = 'calc(var(--ag-font-size) + 1px)';

        // <a href="https://jqueryui.com/datepicker/">https://jqueryui.com/datepicker/</a>
        $(this.eInput).datepicker({
            dateFormat: 'dd/mm/yy',
            onSelect: () => {
                this.eInput.focus();
            },
        });
    }

    // gets called once when grid ready to insert the element
    getGui() {
        return this.eInput;
    }

    // focus and select can be done after the gui is attached
    afterGuiAttached() {
        this.eInput.focus();
        this.eInput.select();
    }

    // any cleanup we need to be done here
    destroy() {
        // but this example is simple, no cleanup, we could
        // even leave this method out as it's optional
    }

    // if true, then this editor will appear in a popup
    isPopup() {
        // and we could leave this method out also, false is the default
        return false;
    }

}
Custom Number Input Component
This example demonstrates how to use a custom number input as a cell editor. The ‘Price’ column uses a Component
cell editor that is an html Input with type=”number”.
Notice the following:
- The Custom function
NumberInputis defined in thedashAgGridFunctions.jsfile in theassetsfolder. - The Custom
NumberInputis supplied by name viacellEditor. - When editing the number the user may only enter numbers and a decimal point. The number is formatted for display
using avalueFormatter. See
This example has not been ported to R yet - showing the Python version instead.
Visit the old docs site for R at: https://community.plotly.com/c/dash/r/21
import dash_ag_grid as dag
from dash import Dash, html
import pandas as pd

data = {
    "item": ["A", "B", "C", "D"],
    "price": [1154.99, 268.65, 100.00, 96.75],
}
df = pd.DataFrame(data)

columnDefs = [
    {"field": "item"},
    {
        "field": "price",
        "type": "rightAligned",
        "valueFormatter": {"function": """d3.format("($,.2f")(params.value)"""},
        "cellDataType": 'text',
        "editable": True,
        "cellEditor": {"function": "NumberInput"},
        "cellEditorParams" : {"placeholder": "Enter a number"}
    },
]


grid = dag.AgGrid(
    id="custom-number-input",
    columnDefs=columnDefs,
    rowData=df.to_dict("records"),
)


app = Dash()

app.layout = html.Div(grid)


if __name__ == "__main__":
    app.run(debug=True)


"""
Add this to the dashAgGridFunctions.js file in the assets folder

----------------

var dagfuncs = window.dashAgGridFunctions = window.dashAgGridFunctions || {};

dagfuncs.NumberInput = class {
    // gets called once before the renderer is used
  init(params) {
    // create the cell
    this.eInput = document.createElement('input');
    this.eInput.value = params.value;
    this.eInput.style.height = 'var(--ag-row-height)';
    this.eInput.style.fontSize = 'calc(var(--ag-font-size) + 1px)';
    this.eInput.style.borderWidth = 0;
    this.eInput.style.width = '95%';
    this.eInput.type = "number";
    this.eInput.min = params.min;
    this.eInput.max = params.max;
    this.eInput.step = params.step || "any";
    this.eInput.required =  params.required;
    this.eInput.placeholder =  params.placeholder || "";
    this.eInput.name = params.name;
    this.eInput.disabled = params.disabled;
    this.eInput.title = params.title || ""
  }

  // gets called once when grid ready to insert the element
  getGui() {
    return this.eInput;
  }

  // focus and select can be done after the gui is attached
  afterGuiAttached() {
    this.eInput.focus();
    this.eInput.select();
  }

  // any cleanup we need to be done here
  destroy() {
    // but this example is simple, no cleanup, we could
    // even leave this method out as it's optional
  }

  // if true, then this editor will appear in a popup
  isPopup() {
    // and we could leave this method out also, false is the default
    return false;
  }
}


"""