Visualizing Plotly Graphs
This documentation is for Dash Enterprise.
Dash Enterprise is the fastest way to write & deploy Dash apps and
Jupyter notebooks.
10% of the Fortune 500 uses Dash Enterprise to productionize AI and
data science apps. Find out if your company is using Dash Enterprise.
In this chapter, we will touch on creating graphs within Dash Enterprise Workspaces Jupyter Notebooks.
The recommended way to create figures and populate them is to use Plotly Express.
For additional information on other methods, see Creating and Updating Figures in Python.
Plotly Express
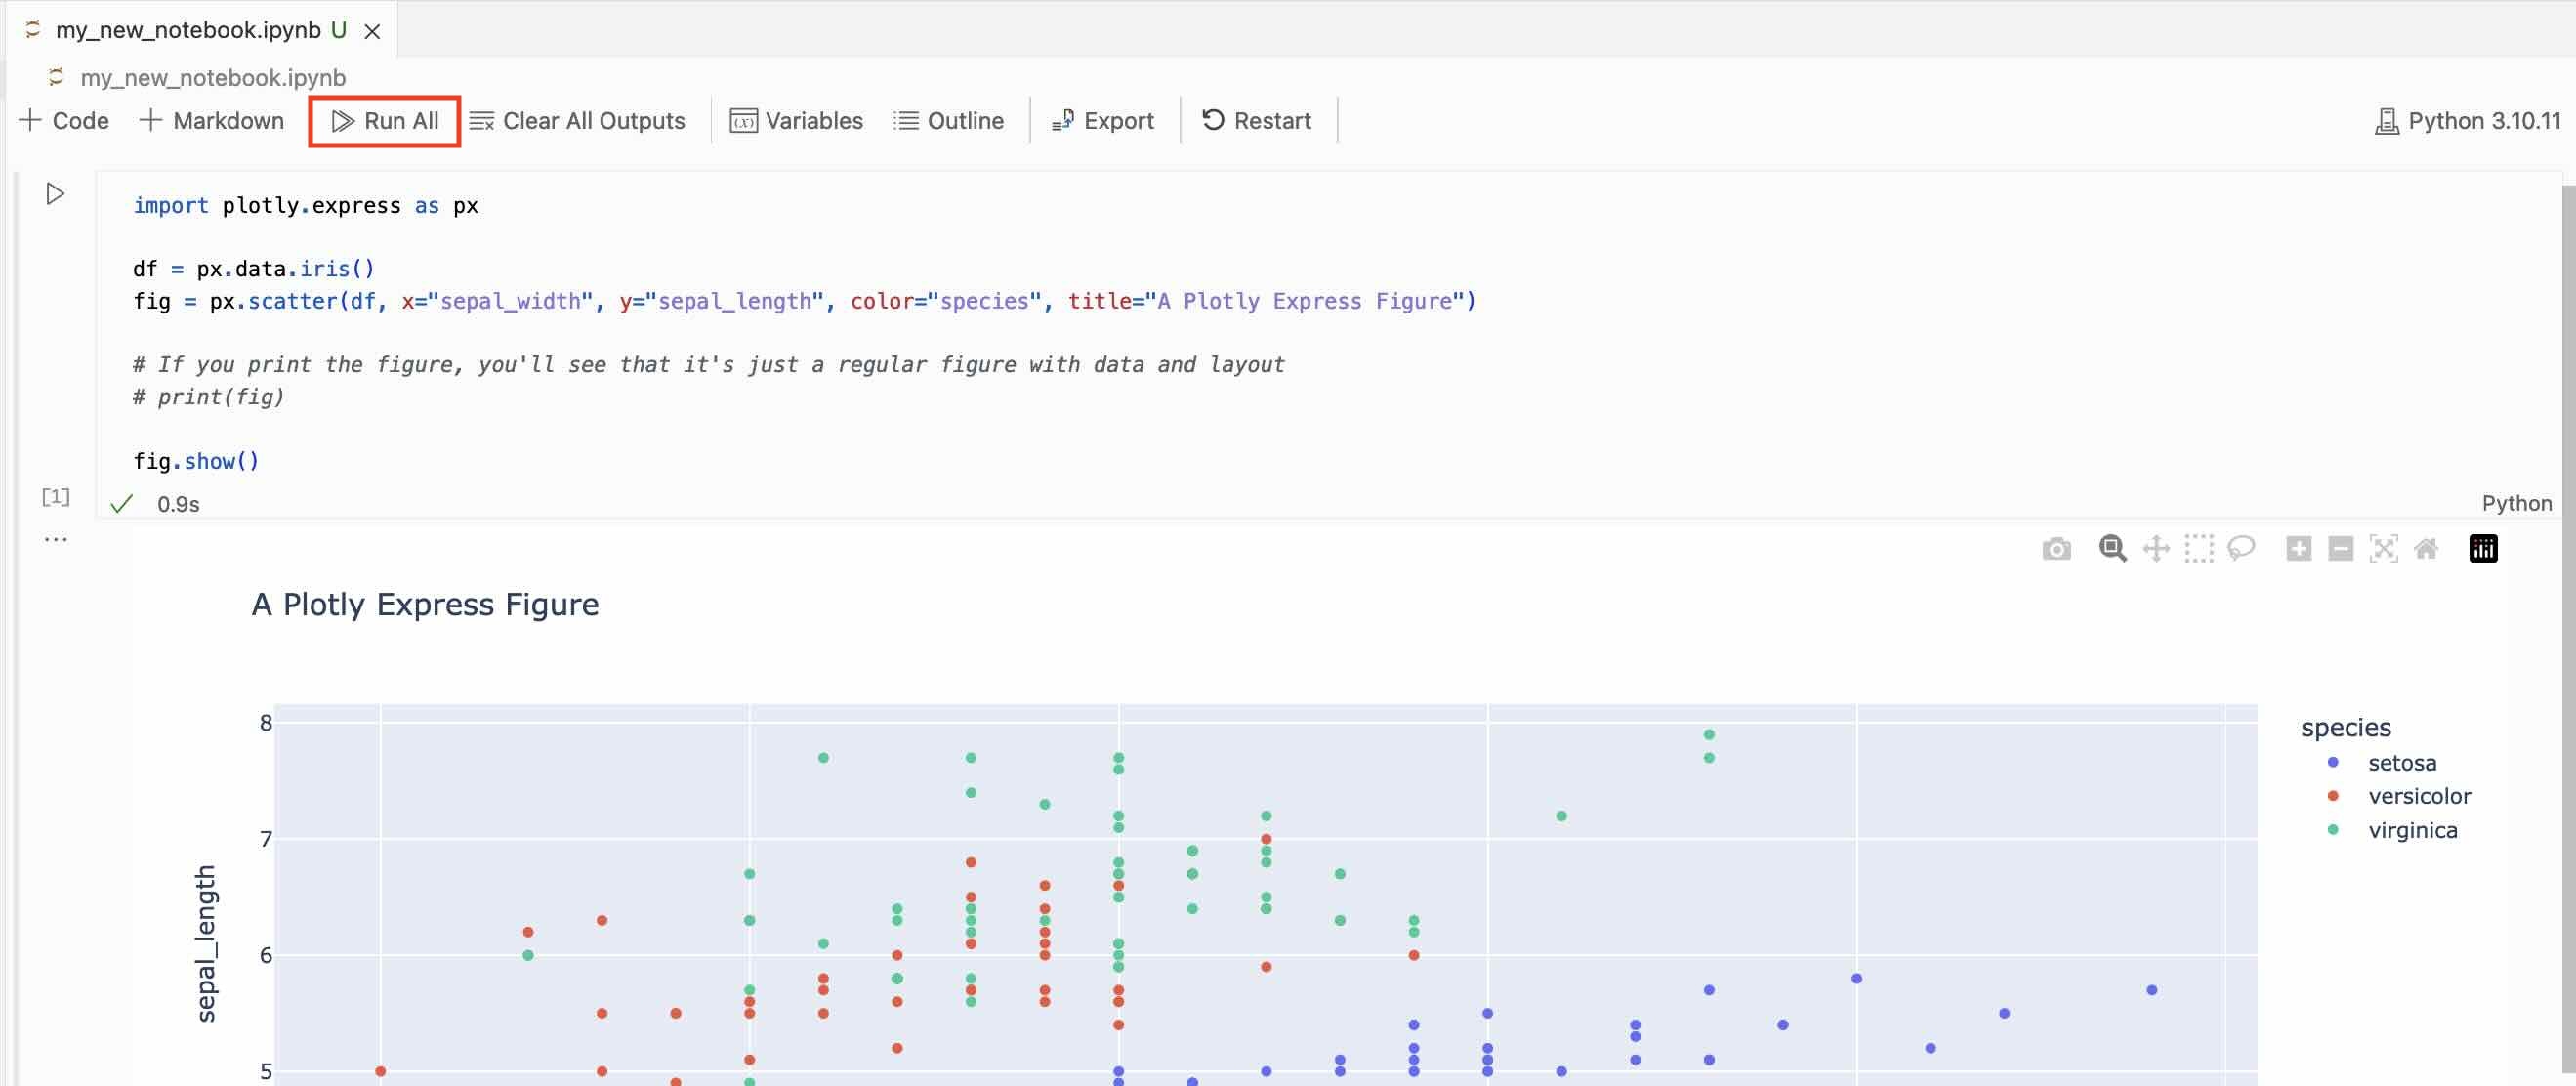
Plotly Express (included as the plotly.express module) is a high-level data visualization API that produces fully-populated graph object figures in single function-calls.
import plotly.express as px

df = px.data.iris()
fig = px.scatter(df, x="sepal_width", y="sepal_length", color="species", title="A Plotly Express Figure")

# If you print the figure, you'll see that it's just a regular figure with data and layout
# print(fig)

fig.show()
Run your Jupyter Notebook to view the figure.
Or, if creating the figure is the last line of a cell, then the figure will be displayed automatically. See Displaying Figures for more details.

Graph Objects
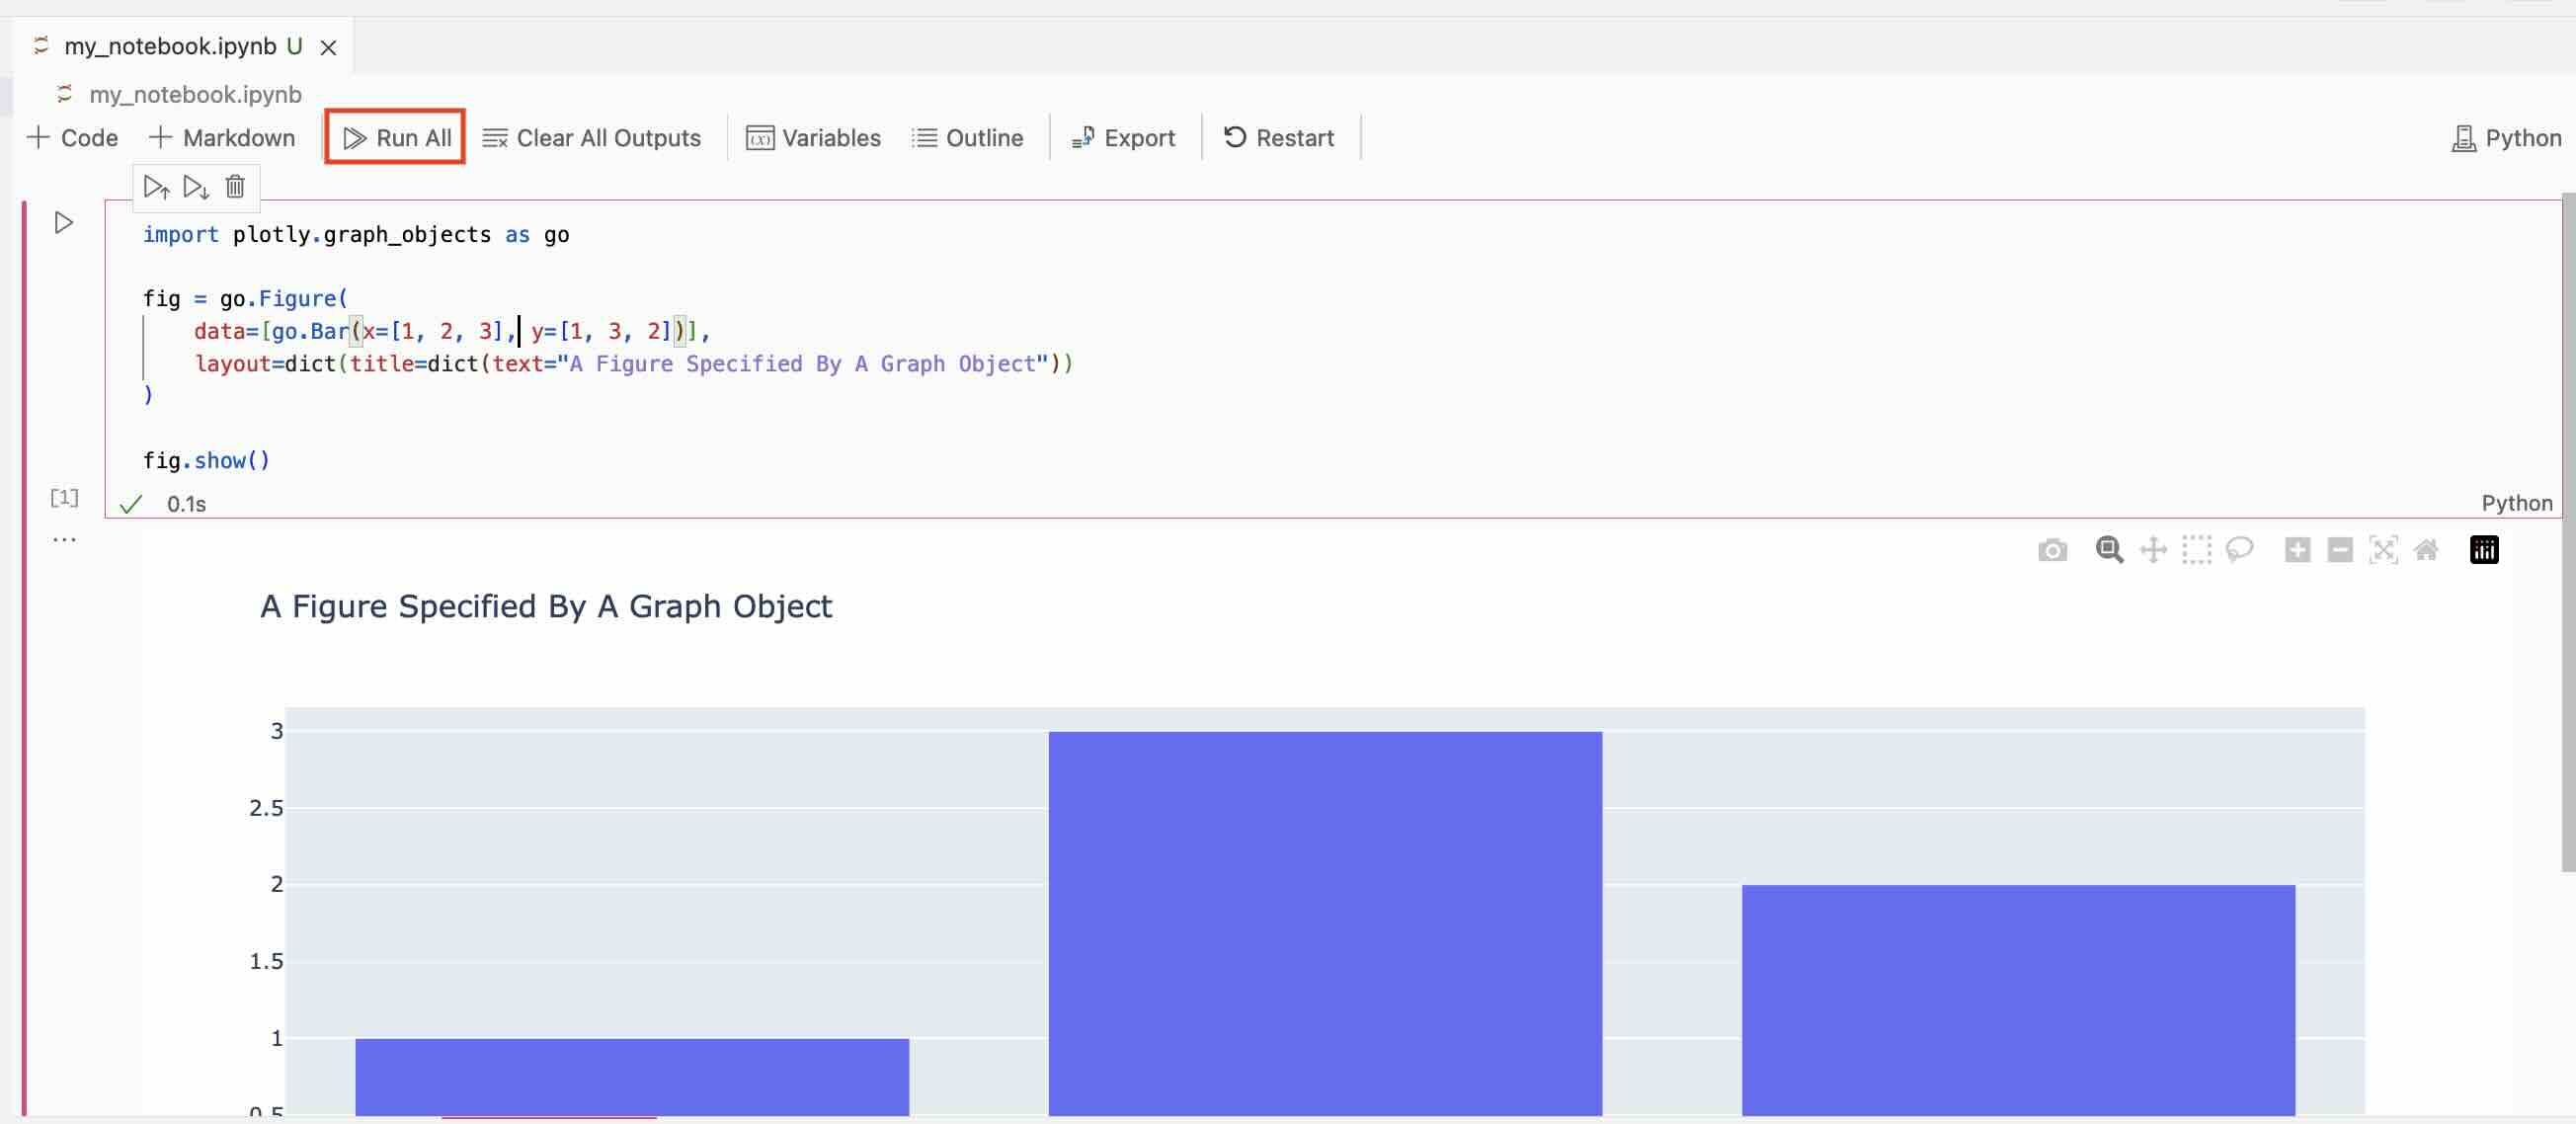
You can build a complete figure by passing trace and layout specifications to the plotly.graph_objects.Figure constructor. These trace and layout specifications can be either dictionaries or graph objects.
In the following example, the traces are specified using graph objects and the layout is specified as a dictionary.
import plotly.graph_objects as go

fig = go.Figure(
    data=[go.Bar(x=[1, 2, 3], y=[1, 3, 2])],
    layout=dict(title=dict(text="A Figure Specified By A Graph Object"))
)

fig.show()
Run your Jupyter Notebook to view the figure.
Or, if creating the figure is the last line of a cell, then the figure will be displayed automatically. See Displaying Figures for more details.
